 WTFutures
Keep the script and its reference files
Start from a saved result so you know exactly which strategy you are installing.
- Open a strategy in the Strategy Library or your saved Strategy Lab result. Visitors can view a public saved test; sign in to download an eligible script.
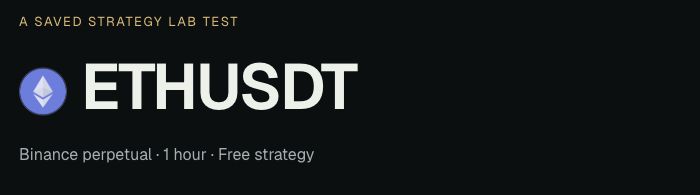
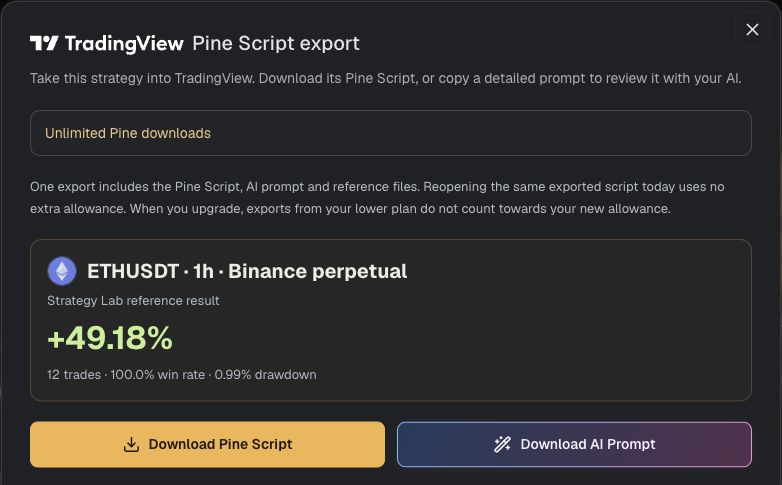
- Choose the Pine Script / TradingView export action. Read the pair, timeframe and Spot or Perpetuals market.
- Select Download Pine Script or Copy Pine Script. Open a downloaded
.pinefile in a plain-text editor to copy its complete contents. - Keep Testing notes and Reference trades CSV with the original. They identify the period, costs, settings and individual trades.
Prepare one clear chart
The exchange, market and timeframe are part of the strategy. Match all three.
- Open Manage layouts → Create new layout in TradingView and give the walkthrough a recognisable name. Keep your existing layouts. If your plan’s saved-layout limit is reached, use a suitable existing workspace deliberately.
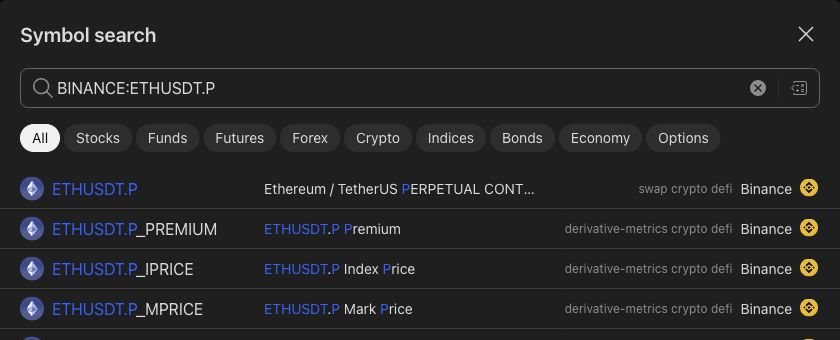
- Use Open this pair in TradingView in the export window, or search for the exact
Original chart:symbol in the source. Open this example chart . - Set the exported candle timeframe. The interval selector changes candle duration; the viewing-range buttons change how much of the chart is visible.
- Use standard Candles. Keep one copy of this strategy visible so its settings, panel and report are easy to identify.
| Part | Check this |
|---|---|
| Exchange | Match the saved Binance feed. Another exchange supplies different candles and volume. |
| Ticker & market | ETHUSDT spot and ETHUSDT.P perpetual are different markets. Read the description; avoid substituting a mark-price, index or premium feed. |
| Timeframe | Match the export’s interval. Daily can be labelled 1D; a one-hour interval is not a one-month viewing range. |
| Chart type | Standard candles use market OHLC prices. Synthetic charts such as Heikin Ashi and Renko are rejected by these exports. |
TradingView reference: Create, name and save a layout
Create, paste, save and add
Replace the complete starter strategy. Saving and adding to the chart are separate actions.
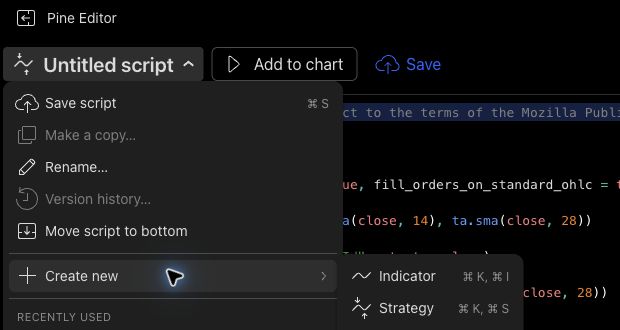
- Open Pine Editor. It can appear beside or below the chart, depending on your layout.
- Open its script-name menu, then choose Create new → Strategy.
- Click in the code editor, select all starter code and paste the entire export. Mac: ⌘A, then ⌘V. Windows: Ctrl+A, then Ctrl+V.
- Check the first line is
//@version=6and the original-chart comment matches. WTFutures export version 7 still uses Pine language version 6; they are different version numbers. - Select Save and name the private strategy clearly, including the pair and timeframe.
- Select Add to chart and wait for compilation. When editing the same existing instance, use its update-on-chart action rather than adding a duplicate.
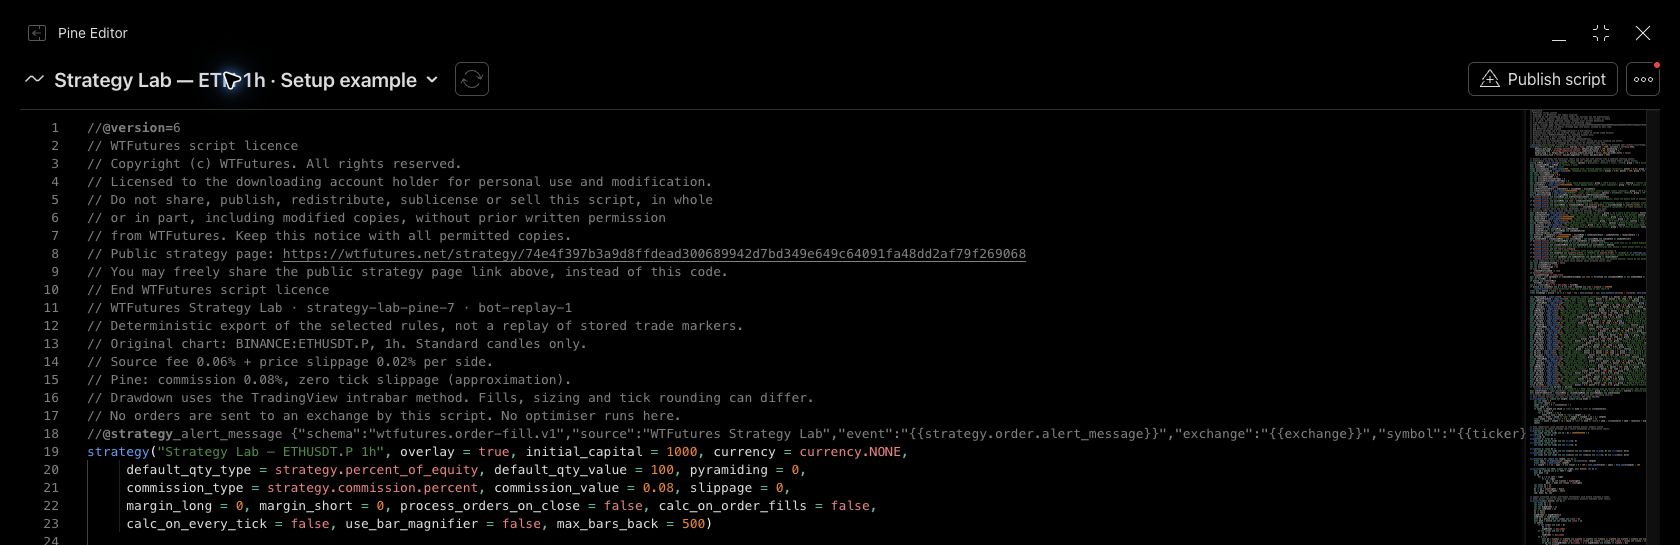
TradingView reference: Pine Editor and script management
Verify the saved History result first
Keep the original Inputs and Properties while comparing the same complete period.
- Open this strategy’s Settings → Inputs. Under History / Live, set Mode to History. Under Chart & test period, keep Match the saved Strategy Lab test checked.
- Read its status panel. SETUP NEEDED means the original start is not loaded; INCOMPLETE means the required end is missing. Load the full UTC period before comparing.
- Select this strategy’s Strategy Report. Open its trade list and compare the reference CSV: entry time, direction, exit time, quantity, costs and exit reason.
- Record the comparison before changing rules, dates, sizing or costs. The public saved result and the current TradingView run can differ. Investigate mismatched trades while keeping the original settings as your baseline.
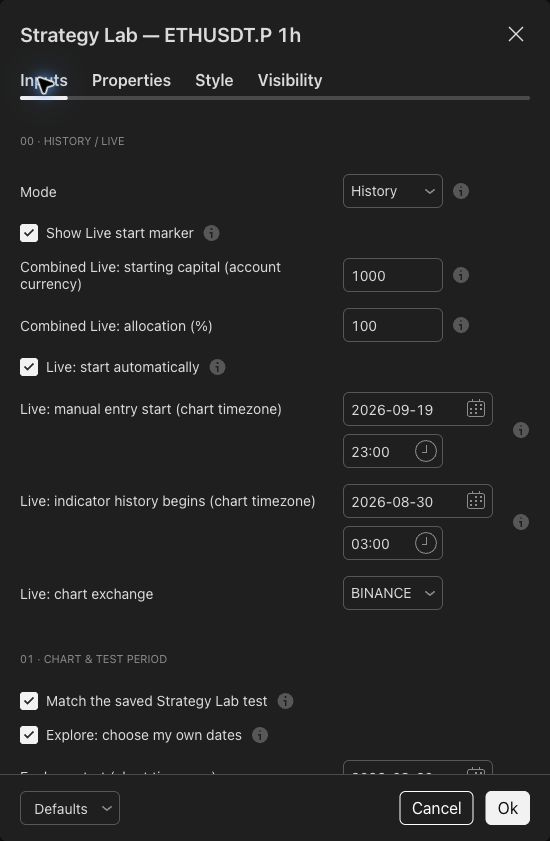
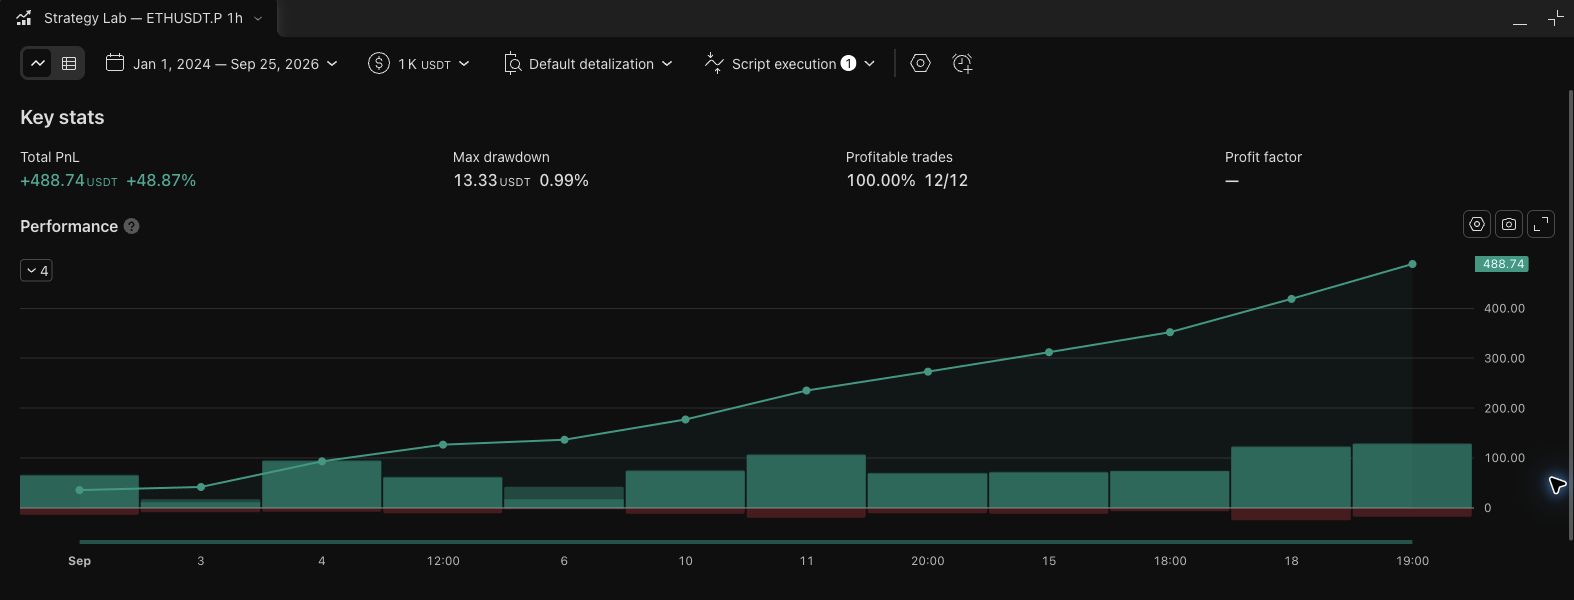
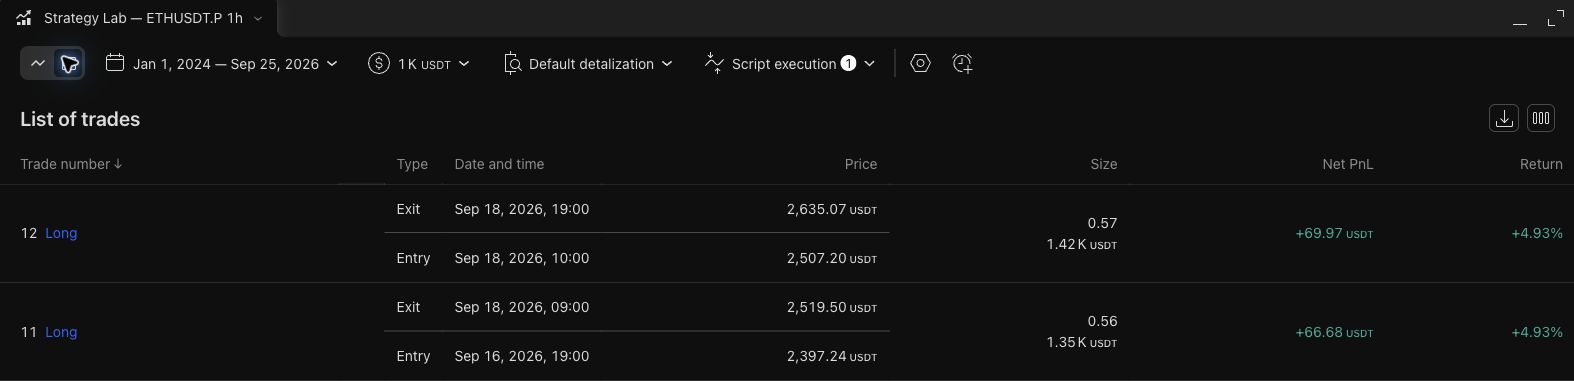
When more history is needed
Use chart date navigation or load earlier candles, then recheck the status panel. If available for your plan and market, a report date range or Deep Backtesting can calculate a longer period. Deep results appear in the report, not as the same markers on the visible chart. The source’s max_bars_back is a calculation buffer; increasing it does not download history or set the number of tested candles.
The saved test
Its frozen dates, market, settings and account define the reference. Historical alerts are disabled.
A later experiment
Extended dates, new Live trades or changed rules are separate from the original saved return.
TradingView reference: Deep Backtesting and the visible chart
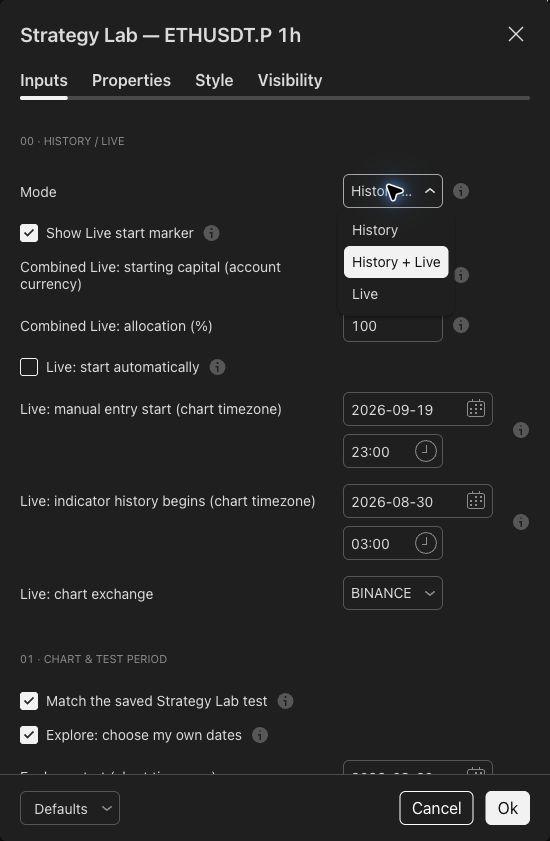
Then choose History + Live
Use this optional mode when you want the historical test and new Live trades in one script.
After checking History, select History + Live in Inputs. Keep the saved period, or deliberately choose another bounded Explore period. Set the custom Live capital and allocation described below.
Finish the selected test
Use its historical sizing and close any remaining position at the end.
Keep calculating, stay flat
Indicators continue. New orders wait for the historical end, Live start and a flat position.
Use your custom balance
A qualifying completed-candle signal can submit a new entry. Only this phase permits fill alerts.
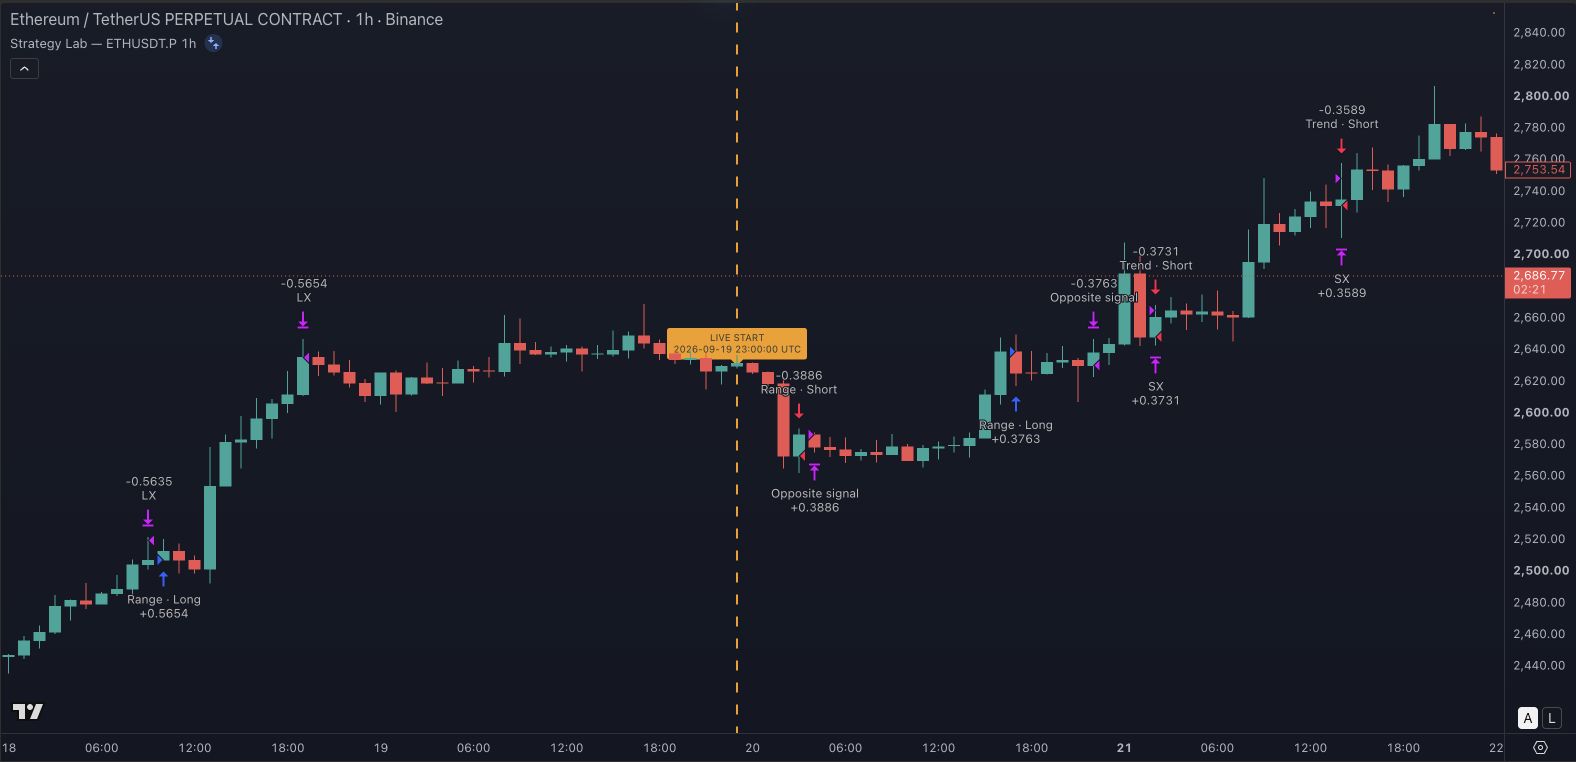
See where the Live phase begins
The labelled amber vertical line marks the actual Live phase activation, not the first Live trade. It appears after the historical test has finished, the position is flat and the Live start has arrived. The actual activation can be later than the requested start; a qualifying signal is still needed for a trade. The marker is absent in History mode and while Combined is waiting. In Live-only mode, it marks the first completed candle in the active Live period at or after the effective start. Show Live start marker is on by default and can be switched off independently of the details panel and indicator lines.
| Mode | What it runs | Sizing |
|---|---|---|
| History Fresh-export default | The selected historical test. No trade alerts. | Properties initial capital and default order size. |
| History + Live | The bounded historical test, followed by eligible Live trades. One combined report. | History: Properties. Live: custom capital and allocation in Inputs. |
| Live | Older candles warm indicators without trading. Entries begin from its effective Live start. | Properties capital and default order size. Combined Live inputs do not apply. |
Choose the start you can explain
Current exports use a fixed Live start that stays the same after chart reloads.
A fixed starting point
Live: fixed entry start initially uses the download’s preparation time, or the historical end if later. Reloading the chart keeps that same instant.
A past start includes simulated trades since then. Combined mode still waits for its historical end and a flat position.
Choose a future time
Set Live: fixed entry start a few minutes ahead, at or after the historical end. Finish creating the alert before that time.
Use identical chart, loaded history, Inputs and Properties. Neither the time nor the amber marker forces a trade; the rules must produce a qualifying signal.
| Control | Meaning |
|---|---|
| Match the saved Strategy Lab test | Uses the export’s original history and chart. The correct default timestamps are already supplied. |
| Explore: start / end, exclusive | Used when saved matching is off and Explore dates are on. The candle opening at the end is outside the historical period. Use candle boundaries for an exact comparison. |
| Live: fixed entry start | The earliest qualifying close for a Live entry. Its saved instant persists across reloads. A past date includes simulated post-start trades; a future date waits. Neither forces a signal. |
| Live: indicator history begins | Applies to Live-only mode. Keep enough earlier history to initialise indicators. Combined mode continues its indicators from the historical period instead. |
Enter UTC dates in a UTC chart
Notes and status panels use UTC. TradingView’s time-input fields display the chart timezone, even when an older field says “UTC”. Select UTC before typing UTC dates. Changing timezone changes the display, not the stored instant; supplied timestamps do not need re-entry.
Refreshing and alert snapshots
Current scripts retain their fixed entry start when the chart reloads. TradingView alerts run a separate saved copy of the script and its settings. Changing the chart later does not update that copy—including switching the chart back to History. Stop the old alert and create a new one after changes. Matching start times prevents a moving-start mismatch, but feeds, available history and other settings must match too.
TradingView reference: Time inputs and chart timezone
TradingView reference: Recalculation and cached configurations
Set capital, allocation and costs
Use Inputs for custom Combined Live sizing. Properties still controls the native account and trading assumptions.
| Control | Applies to | What it changes |
|---|---|---|
| Combined Live: starting capital (account currency) | Combined Live | A fresh sizing amount in the strategy’s account currency. |
| Combined Live: allocation (%) | Combined Live | The portion of its current custom balance allocated to a new position. This is not maximum loss or stop risk. |
| Properties: initial capital | Native strategy account | The historical account and report base; also used in Live-only mode. No reset occurs midway through Combined. |
| Properties: default order size | History and Live-only | The default sizing rule. Combined Live supplies an explicit quantity instead. |
| Properties: costs and execution | Both phases | Commission, slippage and broker-emulator assumptions. |
Historical compounded profits are excluded. Closed Live results already include entry and exit commissions.
Combined Live calculates quantity at the signal candle’s close, using the allocation, account-currency conversion, instrument contract value and minimum quantity step. It rounds down. The market order normally fills at the next open, so a price gap changes the resulting position value. A quantity rounded to zero cannot open a trade.
New entries are submitted only while flat. With a Live position open, the panel also includes unrealised P/L and entry commissions already paid; it does not deduct an estimated future exit fee. This balance is a simulation, not your exchange wallet.
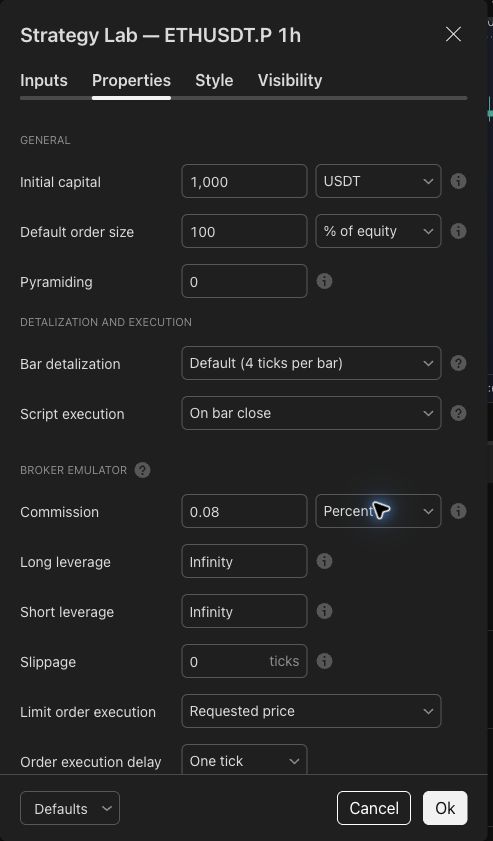
- Fees and slippage: read the source comment and notes. The export approximates percentage slippage by adding it to percentage commission, with zero tick slippage. Adding tick slippage introduces another assumption.
- Execution: preserve completed-close decisions, next-available fills, no every-tick or after-fill recalculation, no pyramiding and the exported Bar Magnifier setting for comparison.
- Currency: enter Live capital in the strategy account currency shown in Properties, which may differ from your wallet’s display currency.
- Margin: any enabled emulator margin constraints still apply. Custom Live capital does not fund its native account or override margin rules. Preserve the exported settings for the reference comparison.
TradingView reference: Strategy Properties and order sizing
Create one optional strategy alert
Finish the settings first. Adding the script to the chart does not create an alert.
- Use Combined or Live mode deliberately. For matching chart and alert anchors, use the same fixed future entry start.
- Open Create alert. In Condition, select this exact strategy instance, not chart price or another indicator.
- Choose Order fills only where an event selector is offered. One strategy condition covers its entry and exit messages; do not add separate long and short indicator conditions.
- Keep Enable Live trade alerts enabled in the settings captured by the alert. History orders stay silent. Combined permits alerts only after its Live handoff.
- Check the included message, name, expiration and desired notifications. A connector requires its own verified setup; private webhook URLs belong in the intended private notification field, never in public screenshots.
- Create the alert and inspect its active state and log. A new realtime order fill is required; historical fills are not replayed as notifications.
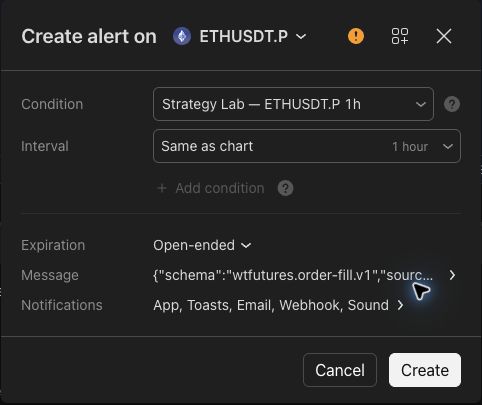
You can also open this form with Add alert beside the settings button in the Strategy Report. Review the Notifications destinations, including any saved webhook, and disable destinations you do not intend to use.
A fixed start and matching settings make the intended setup repeatable; they do not guarantee identical data or fills across separate calculations. Keep the TradingView alert log separate from any external connector’s receipt or execution log.
TradingView reference: Strategy fill events and alert snapshots
Keep the chart readable
Use display controls for clarity without changing the rules.
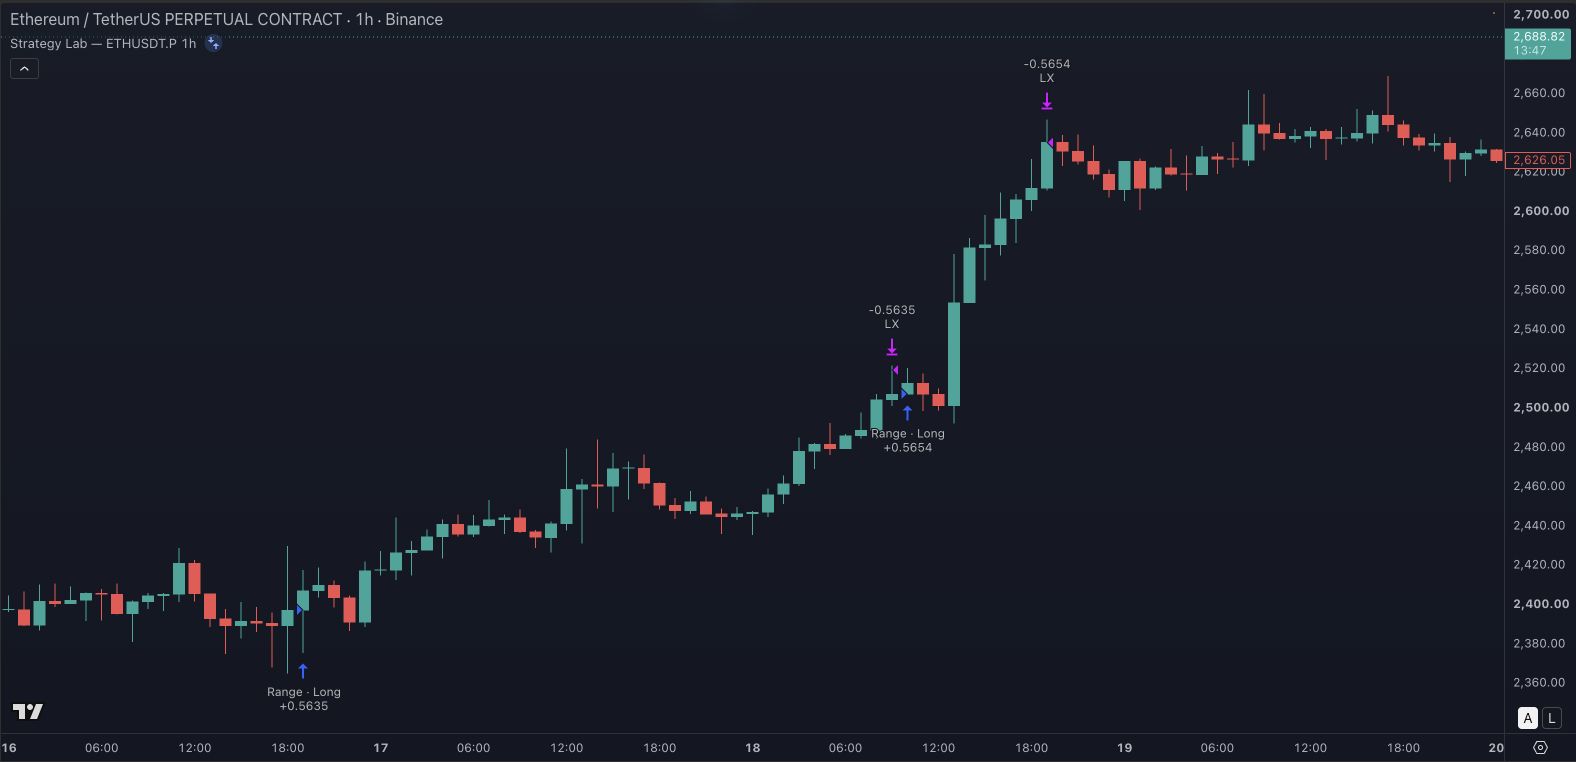
| To do this | Use this | Effect |
|---|---|---|
| Reduce overlaid lines | Show indicator lines / Show stop-loss and profit-target lines | Changes plots, not orders or calculations. |
| Read mode, dates and Live balance | Show test details on chart | Displays the setup state. Required missing-history guidance can still appear. |
| Show the Live phase boundary | Show Live start marker | Shows the amber line and UTC activation label. This display toggle does not change entries or alerts. |
| Hide unrelated objects | Their visibility controls | Reduces clutter without deleting saved drawings. Do not change global drawing synchronisation just to clean this chart. |
| Change the strategy | Indicator lengths, branch toggles, directions, stops and targets | Creates a changed experiment; recheck results and recreate alerts that should use it. |
Keep one visible copy and check its title before opening settings or a report. A saved layout can contain several scripts; make sure the report belongs to this one. Save the layout after deliberate changes.
Find the cause, one check at a time
Start with the complete chart identity and the script’s status panel.
The chart says “Live chart mismatch”
Check exchange, full ticker, .P suffix and timeframe together. Spot does not become perpetual in another mode. Another feed changes the comparison and must match the supported exchange input. Older daily exports can reject 1D because of an old D check; current exports compare duration. Keep the original and compare a fresh export.
“SETUP NEEDED” or “INCOMPLETE” appears
Load the required start and end shown in UTC. Saved mode waits for its exact first candle. A larger calculation buffer or more visible chart space does not download missing bars. Use the full report period or Deep Backtesting where available. Explore is a deliberate different test.
The first run shows Combined or Live instead of History
Fresh exports default to History, but upgraded downloads preserve selected Inputs and an existing chart can retain its own settings. Open the intended strategy, choose History and Match the saved test, then check its original Properties.
Combined says “Waiting for Live”
Check the historical end, requested Live start and whether the historical position has closed. All must be satisfied. Automatic start excludes earlier Live entries; a future fixed date waits. After readiness, a qualifying completed-candle signal is still needed.
The start is rejected or both date checkboxes are off
Combined requires a historical end: keep saved matching on or enable Explore dates. Its manual Live start must be at or after that end. Use History to explore all available candles with no end.
The date or automatic start changed
Compare the chart timezone with the UTC panel. Current downloads keep their fixed entry start after recalculation. Older automatic exports could change their anchor on reload. Download the updated script, choose a future fixed start and recreate its alert.
Changing Properties did not change Combined Live size
Change Combined Live capital and allocation in Inputs. Properties default order size controls History and Live-only. Contract steps, rounding, small balances and next-open prices affect the final size. Changing settings recalculates the chart but does not update an existing alert.
The report still includes historical compounded profits
Combined retains the single native account and report. Its custom Live balance controls sizing without erasing that history. Read the panel’s Live balance, and inspect a new trade’s quantity to check allocation. Choose History to isolate the saved comparison.
There are no trades after the start
Confirm loaded indicator history, enabled branches and the completed-candle interval. A start permits entries; it never forces a signal. Both directions qualifying together can prevent entry. Check for a zero-rounded quantity or any enabled margin constraint preventing a fill.
The return differs from the public saved result
Choose History, restore original Inputs and Properties, and load the exact period. Compare CSV entries and exits. Feeds, volume, costs, rounding, gaps and intrabar assumptions can change fills. A later Explore or Live period is a new experiment, not part of the original saved return.
Compilation fails after pasting
Replace all starter code with the full Pine file, not the AI prompt or Markdown fences. Keep the version line and licence notice. Record the full error and line number if it persists, together with any edits you made.
An older download has a Live date in the year 2100
That was a manual-start placeholder. Current exports use a fixed start set when the download is prepared, or the historical end if later. Download the update, preserve the original and compare History. A far-future date is not needed to display the saved test.
TradingView shows an orange alert warning
Open the warning to read TradingView’s explanation about calculations that can repaint. Current exports use a fixed start and completed-bar execution. Older automatic-start exports can have different chart and alert anchors. Preserve matching settings and read the actual warning before proceeding. Check the alert’s behaviour and log before connecting an external execution service; the warning alone does not verify whether a particular setup is suitable.
The alert is silent or duplicated
Confirm its strategy condition, active state, expiration, saved Live setting and start. Alerts need new realtime fills. Chart edits do not update their snapshots. Inspect the log, replace stale settings if appropriate, and check for an older active copy.